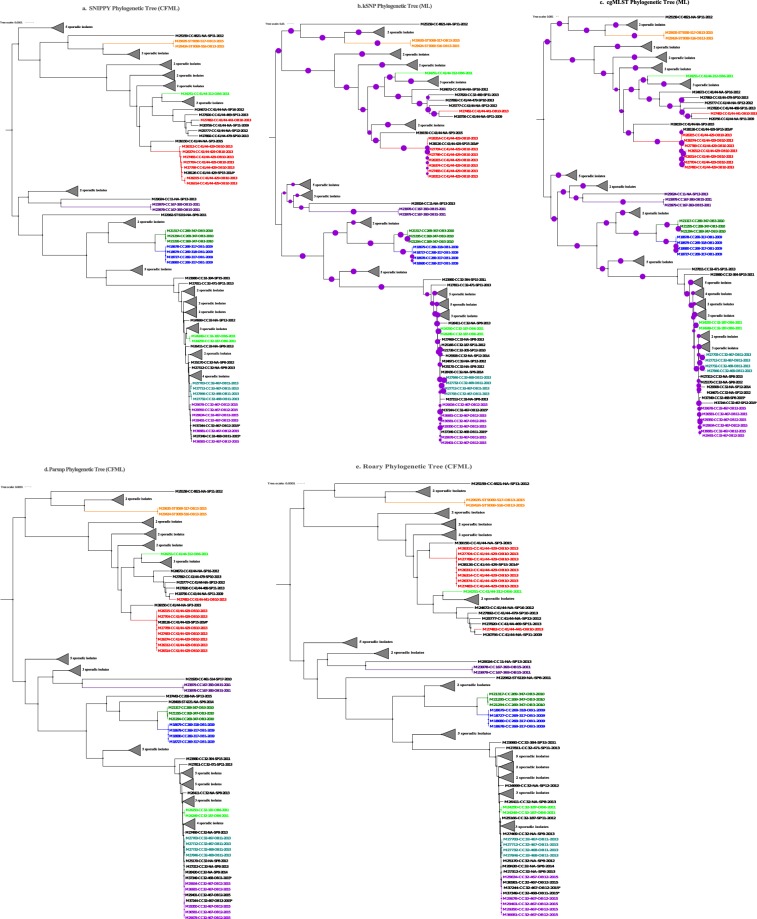
Figure 1.
Phylogenetic trees generated using different WGS analysis methods for NmB outbreak and sporadic isolates, 2009–2015. (a) SNIPPY Phylogenetic Tree reconstructed from a whole genome core alignment generated based on reference-based short read mapping and corrected for recombination using ClonalFrameML. (b) kSNP Phylogenetic Tree, a maximum likelihood (ML) phylogenetic tree generated using RaXML from the core SNP alignment generated by kSNP. (c) cgMLST Phylogenetic Tree, an ML tree created from the concatenated core gene alignment using RaXML. (d) Parsnp Phylogenetic Tree reconstructed from a whole genome core alignment generated using Parsnp and corrected for recombination using ClonalFrameML. (e) Roary Phylogenetic Tree generated from the concatenated core gene alignment; recombination was corrected using ClonalFrameML. Purple circles represent branch-level bootstrap support out of 100 bootstrap estimates. The circumference of a circle is proportional to the bootstrap support.  represented 100% bootstrap support. Bootstrap support was estimated only for kSNP and cgMLST ML phylogenetic trees; the Bayesian recombination-adjusted phylogenies from ClonalFrameML do not estimate bootstrap values. Isolate label contains isolate ID, CC, PFGE pattern, outbreak or sporadic isolates, and year. Geographically matched outbreak and sporadic isolates are indicated by same number following “SP” or “OB” in label. Each colored branch and isolate label represents a different outbreak.

