Fig. 1.
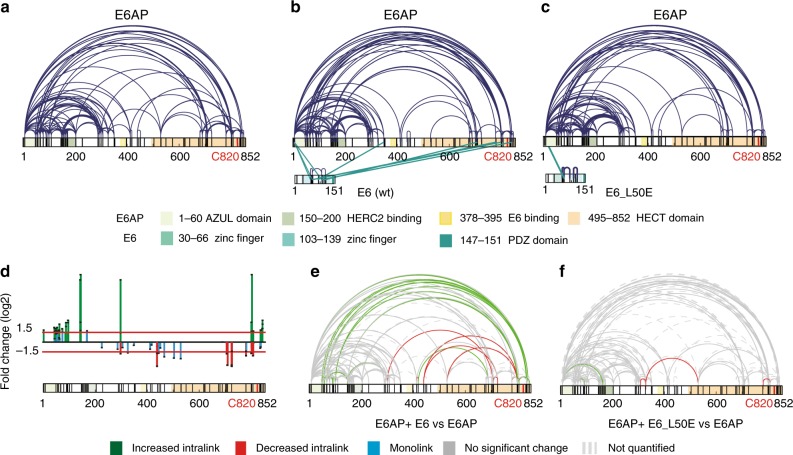
Binding of E6 induces a conformational rearrangement of E6AP. Pattern of intralink distribution within E6AP as determined by XL-MS a in the absence of the HPV E6 oncoprotein, b with wild-type (wt) E6, and c with the E6_L50E mutant, which does not bind to E6AP. Intralinks are shown in dark blue and interlinks in dark green; lysine residues are shown in black. The catalytic cysteine residue of E6AP at position 820 is indicated in red. The AZUL domain, HERC2 and E6 binding sites, and the HECT domain are indicated in pastel green, sulfur yellow and sand yellow, respectively. Regions in E6 representing zinc finger motifs are colored in pastel turquoise and the PDZ binding domain is colored in mint turquoise. d Changes in crosslink abundance for each unique crosslinking site with E6AP upon binding of wild-type E6 were used to calibrate and normalize the quantitative XL-MS (q-XL-MS) data. Changes are expressed as fold change (log2 ratio of abundance of E6AP in the presence of E6 versus abundance of E6AP alone). The horizontal red line indicates the significance threshold (fold change: log2 ratio ≤ ±1.5). Changes in monolinks are shown in blue and significantly changed intralinks within E6AP are shown in green (relative increase upon binding of E6) and red (relative decrease upon binding of E6), respectively. The p values for each quantified link are indicated. e Applying q-XL-MS to recombinantly expressed E6AP in the presence or absence of wild-type E6 identifies numerous high-confidence crosslinks. Only crosslinks that could be reproducibly quantified from the pool of identified high-confidence crosslinks in both samples (with and without E6) (n = 3, each sample analyzed additionally as technical duplicate) and consistently over 3 different biological replicates are shown (violation = 0; p value ≤ 0.01 (two-sided t-test)). Depicted in green are crosslinks that were found to be significantly upregulated upon binding of E6, while downregulated links are shown in red (defined as a log2 change of ≥ ±1.5). Crosslinks with no significant change are depicted in gray while links that could not be reliably quantified are show with a dashed line in light gray. f Quantification of the change in abundance of identified intralinks within E6AP, when incubated with the binding-deficient E6_L50E mutant vs. E6AP alone, reveals no significant up- or downregulated links. For monolinks, see Supplementary Figure 5

