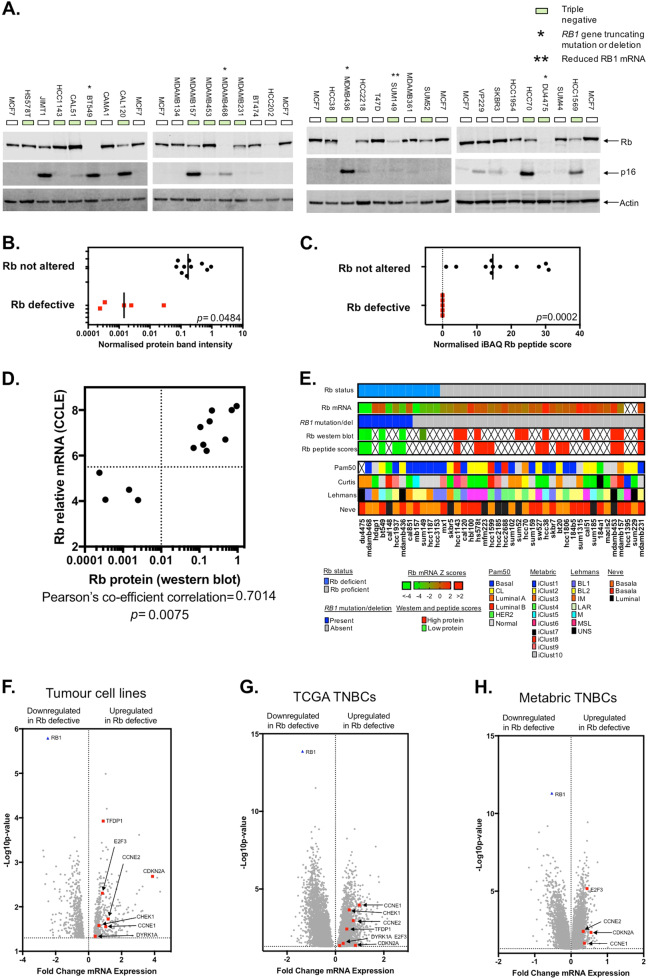
Fig. 1.
Rb status in TNBC tumour cell lines. a Western blot illustrating Rb and p16 protein expression in 30 breast tumour cell lines (TCLs). BT549, MDAMB436, MDAMB468 and DU4475 each possess loss-of-function mutations in the RB1 gene. SUM149 cells express reduced RB1 mRNA. b Scatter plot illustrating quantification of Rb protein levels delineated from a. Protein expression in Rb-defective vs. not altered, p = 0.0484, Student’s t test. c Scatter plot illustrating Rb protein expression in defective and proficient TNBC TCLs estimated by mass spectrometry data from ref. [24]. TNBC TCLs were classified into “Rb-defective” and “not altered” groups according to western blot data from a; using this classification, normalised iBAQ Rb peptide scores were compared and are shown. p = 0.0002, Fishers exact test. d Scatter plot illustrating the correlation between Rb protein and mRNA transcript levels in TNBC TCLs. Rb protein levels from a and b are compared to Rb mRNA transcript levels obtained from the CCLE database [25]. Correlation r = 0.7, p = 0.0075, Pearson’s correlation. e Oncoprint illustrating Rb and breast cancer subtype status amongst 42 TNBC TCLs. f Volcano plot illustrating mRNAs that are differentially expressed (limma analysis p < 0.05) in Rb-defective (vs. Rb not altered) TNBC TCLs. Genes functionally related to Rb are highlighted, as is Rb itself. g Volcano plot of mRNAs that are differentially expressed (limma analysis p < 0.05) in 48 Rb-defective (vs. Rb not altered) triple-negative breast tumours from the TCGA study [27]. Genes functionally related to Rb are highlighted, as is Rb itself. h.Volcano plot of mRNAs that are differentially expressed (limma analysis p < 0.05) in 55 Rb-defective (vs. Rb not altered) triple-negative breast tumours from the Metabric study [28]. Genes functionally related to Rb are highlighted, as is Rb itself

