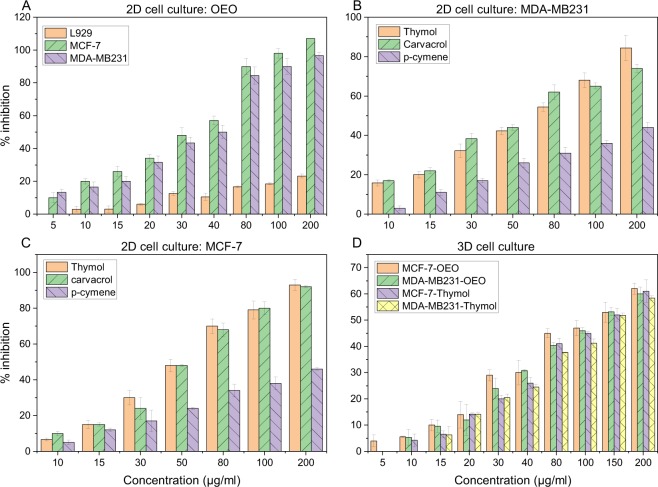
Figure 3.
Growth inhibition of (A) L929, MCF-7 and MDA-MB-231 monolayers after treatment with increasing concentrations of OEO for 24 h (B) MDA-MB-231 monolayers after treatment with increasing concentrations of thymol, carvacrol and p-cymene for 24 h and (C) MCF-7 monolayers after treatment with increasing concentrations of thymol, carvacrol and p-cymene for 24 h D) MDA-MB-231 and MCF-7 spheroids exposed to increasing concentrations of OEO and thymol for 24 h. Cell inhibition percentage and IC50 was determined using the MTT assay. The results are the means ± SDs from triplate experiments (P < 0.05).

