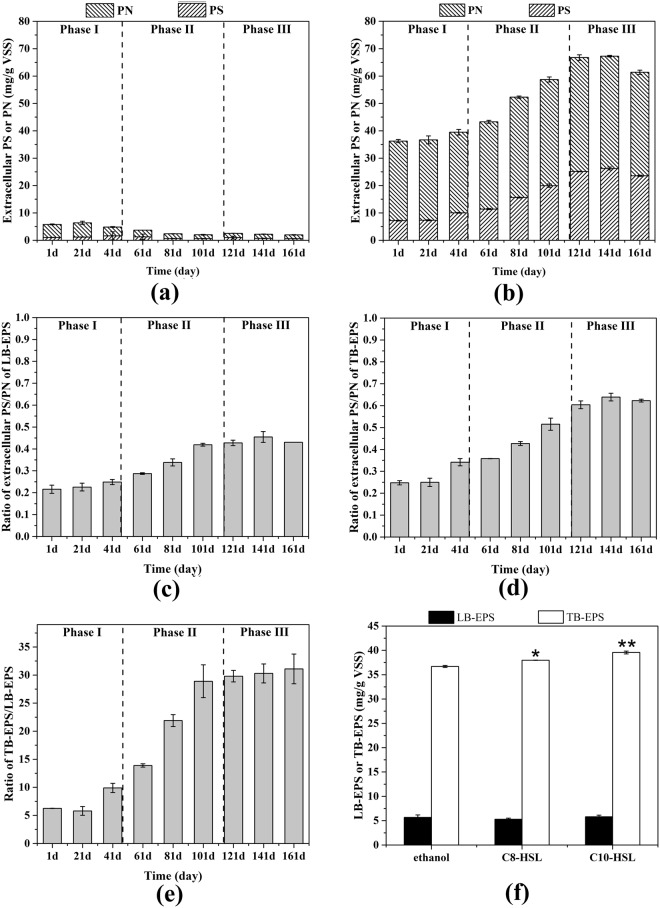
Figure 3.
The concentration of LB-EPS (a) and TB-EPS (b) across the granulation process. The PS to PN ration of LB-EPS (c) and TB-EPS (d) and TB-EPS to LB-EPS ratio (e) during the operation period. Error bars represent standard deviation of three technical replicates. (f) Add-back of 5000 nM C8-HSL and C10-HSL increased the EPS production of anaerobic sludge. Two-way ANOVA was conducted and Bonferroni post-tests were performed to compute the significance. *P < 0.05, **P < 0.01 and ***P < 0.001 were used to indicate different significance.

