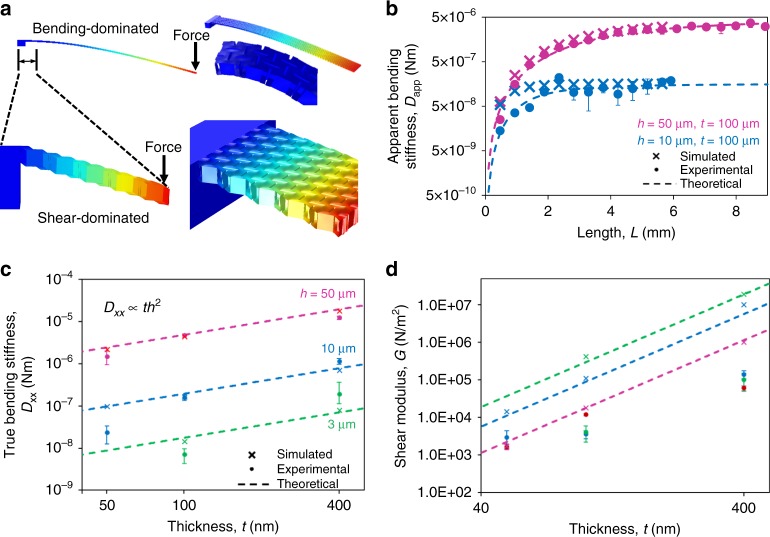
Fig. 2.
Schematic and plots of the cantilever deflection and characterized properties. a Schematic of two different modes of cantilever deflection: bending-dominated deformation of very long cantilevers (top), and shear-dominated deformation of shorter cantilevers (bottom). The insets provide different angled views and magnification to show the bending and shear characteristics. The bottom image shows the staircase pattern of shear deformation that is caused by the disconnected webbing. b Plot of experimental and finite-element-simulated Dapp versus lengths L for two example cantilevers. The experimental data are calculated from the spring constant measured with AFM probing. As the cantilever length increases beyond the critical length Lc~ 1 mm, the apparent bending stiffness saturates, indicating the transition from the shear-dominated to the bending-dominated regime. The data points represent two separate cantilevers. c Dxx and d G extracted from curve fitting, such as that in b, along with the theoretically expected scaling trends. Error bars are provided as 1 standard deviation for the experimental data points. The data were fitted from 9 cantilevers and is representative of ~100 other cantilevers

