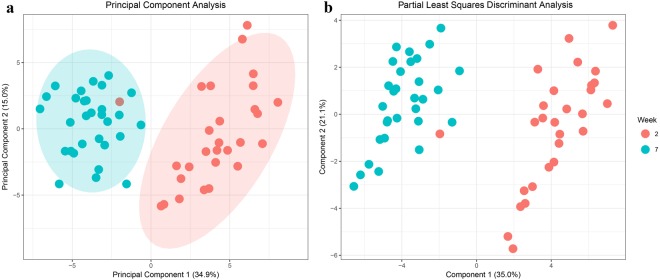
Figure 1.
The combined data of milk metabolomics profiles and milk production traits were separated by lactation week in principal component analysis (a), and were further discriminated by lactation week with a discriminant power of Q2 = 0.86 in partial least squares discriminant analysis (b). Numbers in parentheses is the percentage of explained variation of milk metabolites profiles and milk production traits due to separation between week 2 and week 7.

