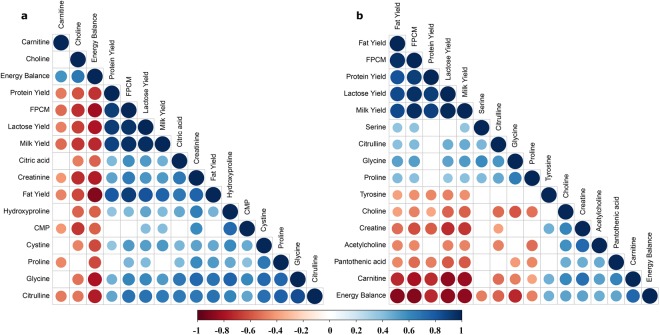
Figure 3.
Pearson correlations matrix between 15 variables in milk with the relatively higher variable importance in projection score from partial least squares analysis and energy balance of dairy cows in lactation week 2 (a) and week 7 (b). The size of dots is proportional to the absolute value of correlations, the blue and red colour represent positive and negative direction of correlations, respectively, and blank represents that there was no correlation between two variables (P-value > 0.05). Abbreviations: CMP, cytidine monophosphate; FPCM, fat- and protein-corrected milk.

