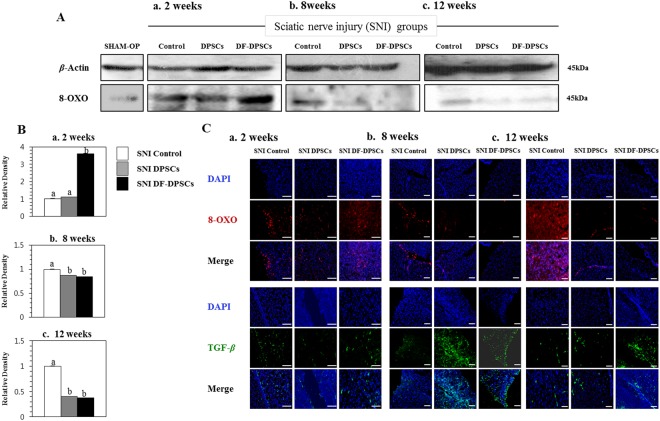
Figure 2.
Protein expression analysis of ROS and TGF-β in rat brain 2, 8 and 12 weeks after surgery. Western blot analysis of 8-OXO (Aa) 2 weeks, (Ab) 8 weeks, and (Ac) 12 weeks after surgery in the SNI groups. Integrated density histograms of 8-OXO after 2, 8 and 12 weeks (Ba–c), respectively β-Actin was used as an internal control. The characters a, b, and c indicate significant differences (p < 0.05) among the SNI groups. Immunohistofluorescence analysis of 8-OXO and TGF- β (Ca) 2 weeks, (Cb) 8 weeks, and (Cc) 12 weeks after surgery. The blue color represents nuclear staining (DAPI) while red (8-OXO) and green (TGF-β) represent Alexa Fluor and FITC staining of secondary antibodies, respectively. Scale bar = 100 µm. SHAM OP represents the normal control. For immunohistofluorescence analysis, 10–14 µm transverse sections of the forebrain region were made. Each picture contains part of the gray cortex, cerebral cortex and white matter.

