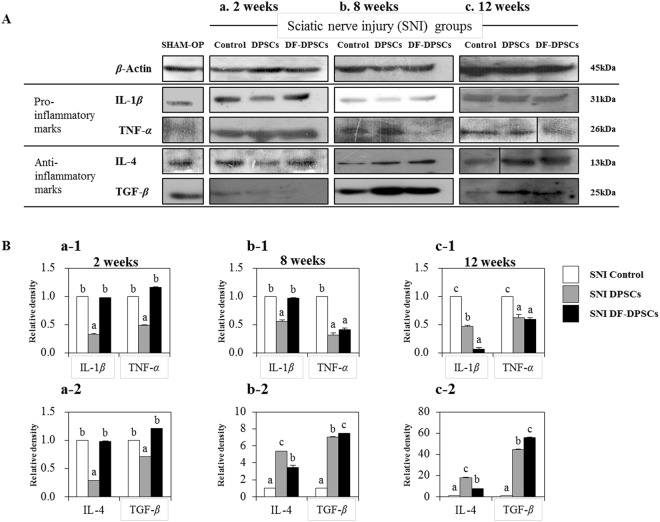
Figure 3.
Western blot analysis of pro- (IL-1β, TNF-α) and anti-inflammatory (IL-4, TGF-β) cytokines in rat brain (Aa) 2 weeks, (Ab) 8 weeks, and (Ac) 12 weeks after surgery. Integrated density histograms of pro- (a-1, b-1, and c-1) and anti-inflammatory (a-2, b-2, and c-2) cytokines in rat brain 2, 8 and 12 weeks after surgery, respectively. β-Actin was used as an internal control. The characters a, b, and c indicate significant differences (p < 0.05) among the SNI groups. SHAM OP represents the normal control.

