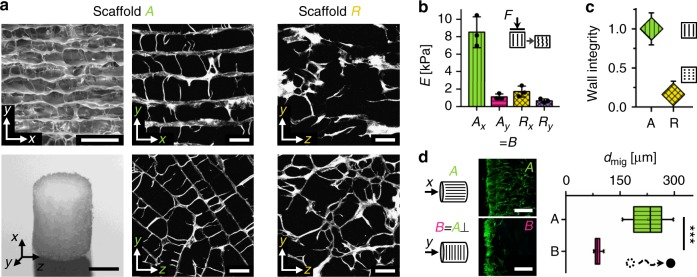
Fig. 2.
Scaffold pore architecture guides cell migration in vitro. a Scanning electron microscopy (SEM) image showing the scaffold pore architecture with highly aligned pores along the x axis (top left). Photograph of the scaffold as used in vitro (5 mm diameter, 3 mm height) (bottom left). SHG images of the scaffold pore architecture for aligned scaffolds A and random scaffold R cut along (top middle and right) and perpendicular (bottom middle and right) to the direction of directional freezing during production. b Mechanical stiffness of the prototypes in the two directions shown in a (median ± SD). Characterization was performed on n = 3 technical replicates. c Analysis of pore wall integrity indicating a pronounced reduction of pore wall integrity along the x direction in random scaffold R compared with scaffold A (median ± SD). Characterization was performed on n = 8 individual multiphoton image stacks. A high wall integrity is a characteristic feature of the channel-like pore architecture of scaffold A. d Quantification of the migration distance dmig for migration of hBMSCs along (scaffold A) and perpendicular (scaffold B) to the pore orientation 3 days after cell seeding. Images on the left show representative cell distribution close to the surface of the scaffold 24 h post seeding (cross-sections stained for F-actin after cell seeding on the base of the scaffold cylinder). Significance calculated by Mann–Whitney test (two-sided). ***p < 0.001, n = 8 biological replicates (hBMSCs from 8 different donors), n = 2–3 technical replicates per donor. Boxplot in d shows the median, 25th and 75th percentile values (vertical bar, left and right bounds of the box), whiskers indicate the 1.5-fold IQR; open squares indicate means; crosses represent maximum/minimum values. Scale bars for a 200 µm in SEM image, 2 mm in photography, 100 µm in SHG images; d 250 µm

