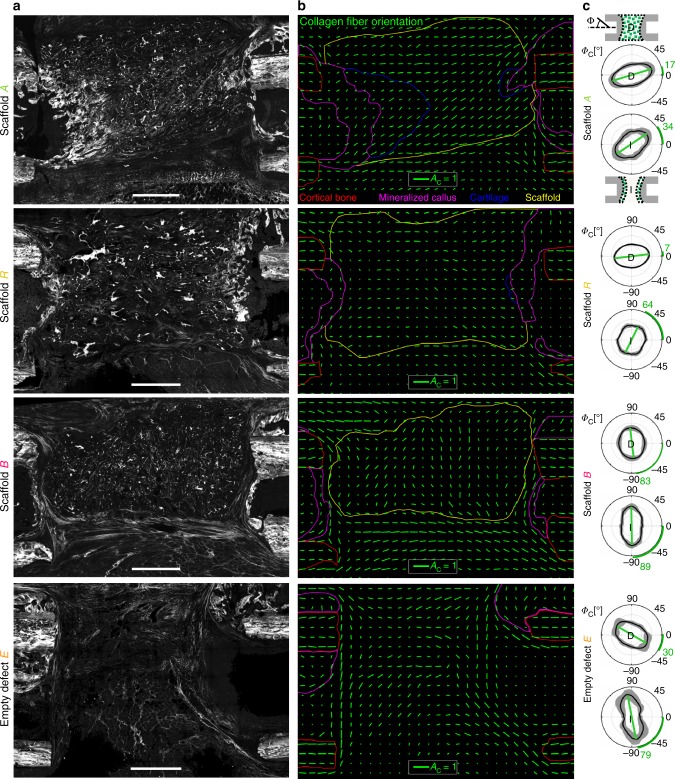
Fig. 4.
Scaffold guides collagen fibril alignment within the bone defect. a Representative SHG overview images of the bone defect 3 weeks post-op. b Analysis of local collagen fiber anisotropy in the bone defect zone for representative animals of each group. Green lines indicate anisotropy AC (length of line) and direction of primary fiber orientation ΦC (angle) within local ROIs of 200 µm × 200 µm size. Notice the pore orientation along the bone axis for scaffold A and perpendicular to the bone axis for scaffold B. Regions contoured by colored lines indicate cortical bone (red), mineralized callus matrix (magenta), scaffold (yellow), and cartilage (blue). c Distribution of collagen fiber orientation ΦC within the scaffold (groups A, R, B) or within the empty bone defect (group E) is shown in diagrams labeled “D”. Polar plots show the distribution of orientation as mean values of all animals per group (bold line) and its SD (gray band). Bone axis is ΦC = 0°. The fiber anisotropy can be read as the degree of polarization of the curve (long vs. short axis). Green lines and according green numbers indicate the angle of primary fiber orientation. Analysis of the local fiber orientation at the interface (diagrams labeled “I”) reveal stability of orientation along the bone axis only in scaffold A, whereas orientation in all other groups is dominated by the interface itself with fibers parallel to it and perpendicular to the bone axis (see also Fig. 1c). n = 5–7 animals for c. Scale bars for a 1 mm; b collagen fiber anisotropy AC = 1

