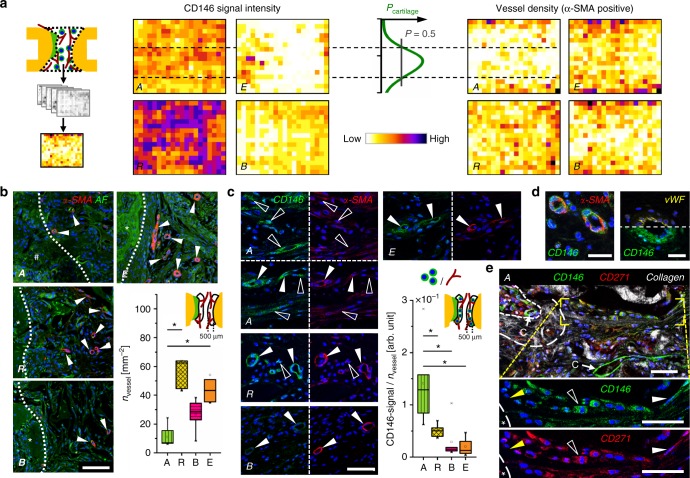
Fig. 7.
High progenitor cell number and low vessel density constitute the environment for EO. a Heatmaps show distribution of CD146 signal and α-SMA-positive vessel density as mean values of all animals for groups A, R, B, and E. The probability to find cartilage in scaffold A was highest in the region with low number of vessels and high number of CD146+ cells (region of Pcartilage > 50%), see also Supplementary Fig. 10. b Immunohistological staining for α-SMA (red), cell nuclei (blue), and autofluorescence (AF) signal (green) at the interface between cartilage (group A, hash symbol) or mineralized tissue (groups R,B,E, asterisk) and non-mineralized tissue. Boxplot shows quantification of α-SMA-positive vessels 3 weeks post-op in a ROI of 500 µm from the interface. c Immunohistological staining for CD146 (green) and α-SMA (red) close to the interface showing CD146 signal around vessels, but also associated with individual elongated cells for group A (open arrowheads), bright CD146 signal around vessels for group R (full arrowheads), and lower CD146 signal around vessels for group B and E. Boxplot shows the ratio between CD146 signal and vessel density 3 weeks post-op in a ROI of 500 µm from the interface. d CD146 and α-SMA signal were both perivascular but did not colocalize. CD146 signal was detected outside the endothelium stained by von Willebrand Factor (vWF) in consecutive sections, verifying the specificity of CD146 staining. e CD146+ cells were found to be involved in the process of EO. Magnifications show cells in the pre-cartilage region (full white arrowheads) and in the cartilage region (open arrowheads) expressing CD146 but also CD271. CD146 signal was also found around capillaries (C) in the pre-chondrogenic region and in the bone marrow (double asterisk). Bone marrow was enframed by mineralized tissue rich in collagen (asterisk). All boxplots show the median, 25th, and 75th percentile values (horizontal bar, bottom, and top bounds of the box), whiskers indicate 1.5-fold IQR, open squares indicate means, crosses represent max./min. values. Significances via Mann–Whitney test (two-sided) with Bonferroni correction for b, c; *p < 0.05. n = 5–7 animals per group for a, b, c. Scale bars for b 100 µm, c, d 50 µm, e 25 µm

