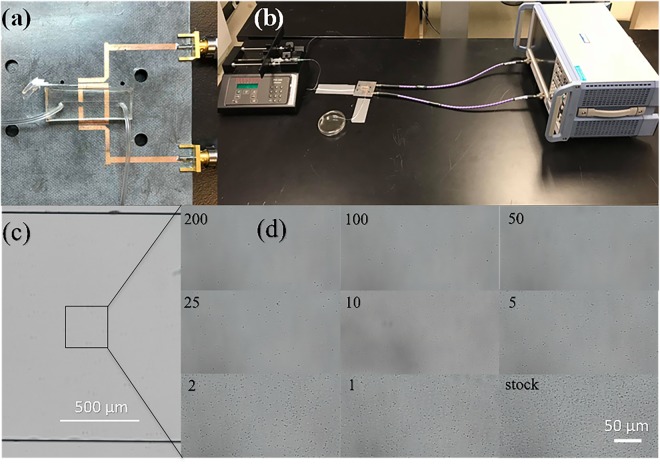
Figure 3.
The sensor, experimental setup, and bacteria imaged within the microfluidic chip. (a) The closeup view of the microwave resonator with the microfluidic chip resting on top secured by double sided duct tape. (b) The experimental setup that includes the syringe pump, flow tubing, microwave setup, waste collection and vector network analyzer (VNA) system. (c,d) Visual illustration of E. coli bacteria at an initial OD600 value of 1.6 and pH 7.5 on top of the active region of the sensor. (c) The bare microfluidic channel while, (d) the subsequent figures show each dilution factor as labelled inside the chip.

