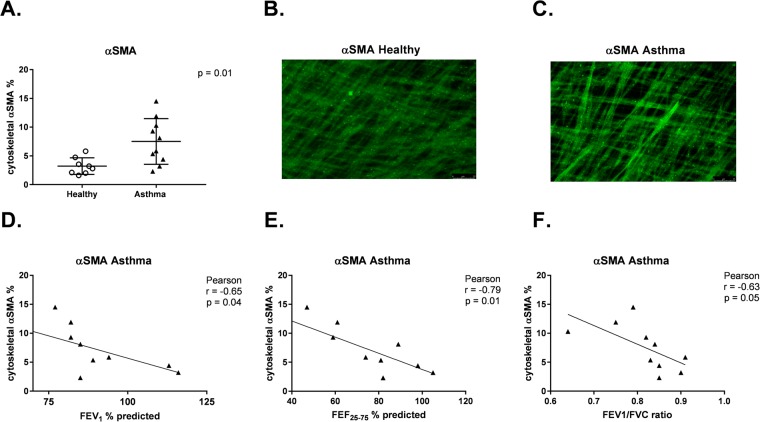
Figure 3.
Correlation between percentage of HLFs expressing cytoskeletal α-SMA following co-culture with healthy or asthmatic BECs and lung function measures of BEC donors. Percentage (%) of HLFs expressing cytosketal α-SMA quantified by flow cytometry following co-culture with healthy (n = 8, open circles) and asthmatic (n = 10, open triangles) BECs. (A) Representative immunohistochemistry (IHC) image of cytoskeletal α-SMA staining of HLFs co-cutured with healthy BECs. (B) Representative IHC image of cytoskeletal α-SMA staining of HLFs co-cutured with asthmatic BECs. (C) Correlations between % HLFs expressing cytosketal α-SMA quantified by flow cytometry following co-culture with asthmatic BECs and the lung function measures FEV1% predicted (D), FEF25–75% predicted (E), and FEV1/FVC ratio. (F) of asthmatic BEC donors were calculated using the Pearson correlation coefficient.

