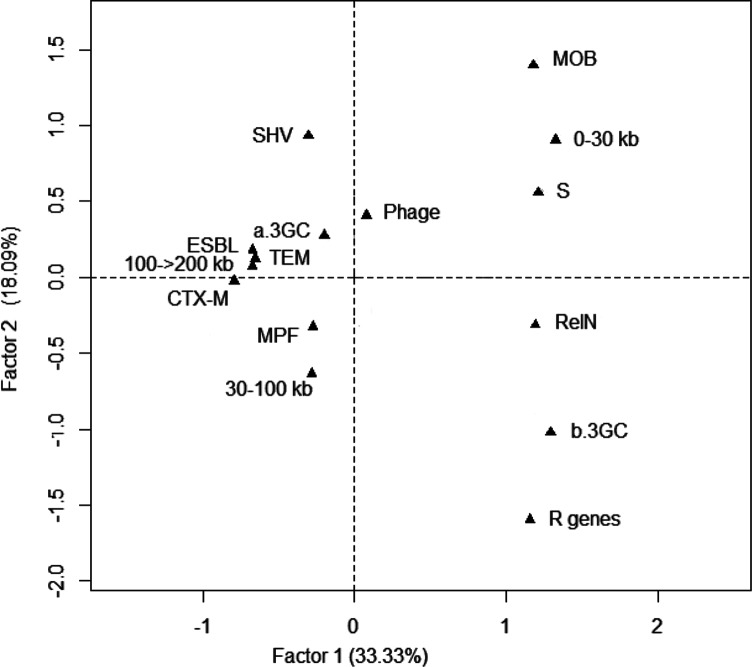
Fig. 2.
Graphical representation of the results of the FAC carried out with whole data from the 116 E. coli plasmids. Projections of the variables on the F1/F2 plane: type of plasmids (MPF, MOB, RelN and phage), size of the plasmids (0–30, 30–100, 100–>200 kb), resistance type [plasmids with at least one ESBL-encoding gene (ESBL), plasmids with non-ESBL resistance genes (R genes), plasmids with no resistance genes (S, sensitive)], type of ESBL-encoding gene (TEM, SHV, CTX-M) and period of isolation [before the use of the 3GCs (b.3GC) or after the use of the 3GCs (a.3GC)]. The percentage of the total variance represented by each factor is indicated.

