
Figure 1.
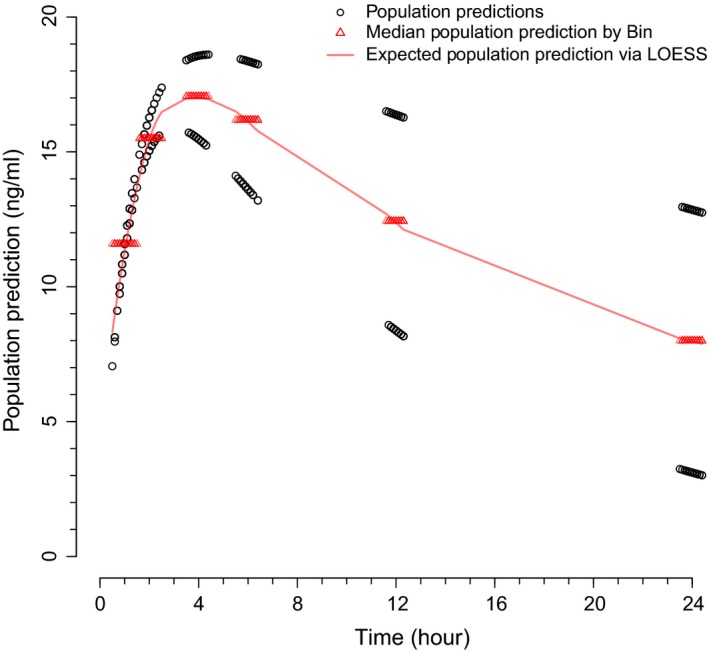
Median population predictions by bin and expected population predictions via LOESS for a hypothetical pharmacokinetic example. The approach to prediction‐corrected visual predictive checks in the current work involves normalizing the population predictions (black open circles) to the expected population predictions via LOESS (red solid line), rather than to the median of the population predictions for each bin (red open triangles).