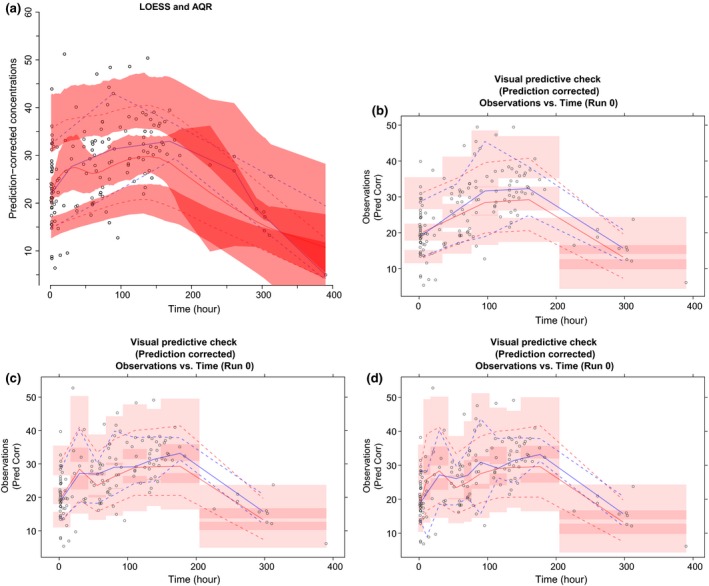
Figure 4.

The prediction‐corrected visual predictive checks (pcVPCs) for the population pharmacokinetic model of phenobarbital. For all plots, the blue solid line represents the observed median and the blue dashed lines represent the observed 10th and 90th percentiles. Similarly, for all plots, the red solid line represents the simulated median and the red dashed lines represent the simulated 10th and 90th percentiles. The pink shaded regions indicate 95% confidence intervals for the simulations. AQR, additive quantile regression.
