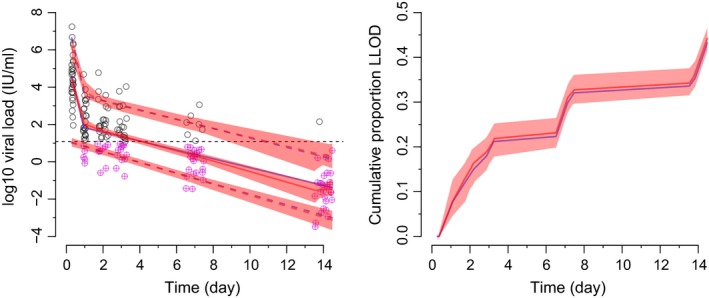
Figure 6.

The visual predictive checks for the population pharmacokinetic‐viral kinetic scenario. For the left plot, the dashed line indicates the lower limit of detection (LLOD), the blue solid line represents the observed median, the blue dashed lines represent the observed 10th and 90th percentiles, the red solid and dashed lines indicate the corresponding simulated percentiles, the pink shaded regions indicate 95% confidence intervals (CIs) for the simulations and the circled purple crosses represent imputed data below the LLOD. For the right plot, the blue solid line represents the observed median, the red solid line represents the simulated median, and the pink shaded region indicates the 95% CI for the simulated median.
