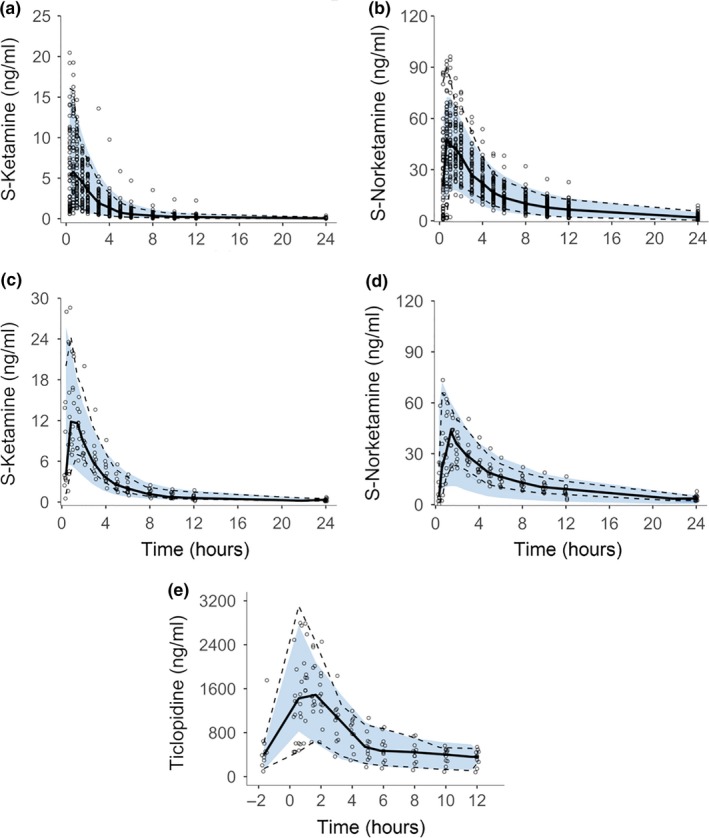
Figure 2.

Prediction‐corrected visual predictive checks obtained from 1,000 simulations stratified on compound and study phase showing S‐ketamine and norketamine after oral administration of 0.2–0.3 mg/kg S‐ketamine during placebo phase (a and b, respectively), during ticlopidine predosing phase (c and d, respectively), and ticlopidine after oral ticlopidine administration of 250 mg/day b.i.d. for 6 days (e). Circles show the observed concentrations, solid lines the median and dashed lines the 2.5th and 97.5th percentiles of observed data. Blue area indicates simulation‐based 95% prediction interval of the final model.
