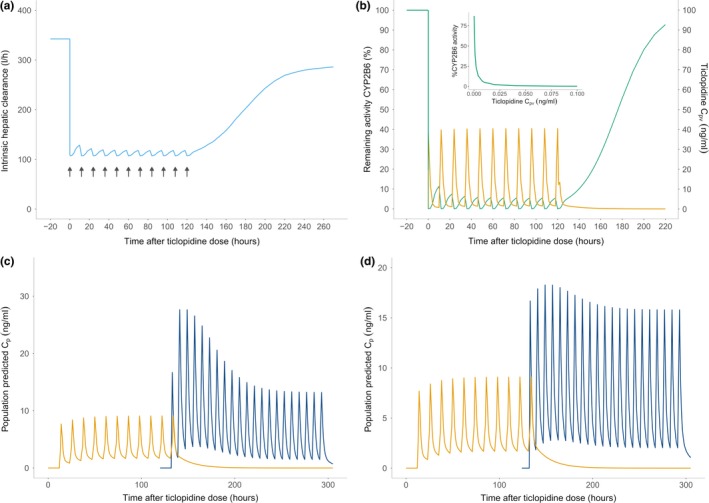
Figure 3.

Simulation results. (a) The intrinsic hepatic clearance (sky‐blue) of S‐ketamine demonstrates the same pattern of a sudden drop, which attains a steady state during ticlopidine dosing, and then recovers quickly during the ticlopidine washout. The black arrows show ticlopidine dosing. (b) The percentage remaining activity (%RA) of cytochrome P450 (CYP)2B6 (green) immediately before, during and after ticlopidine dosing. Ticlopidine portal vein concentration is shown in orange. The %RA was calculated using the reversible and time‐dependent components of the mechanistic static drug‐drug interaction model. A sharp fall in %RA upon ticlopidine dosing resembles an “on‐off” phenomenon, however, the inset graph shows that the inhibition process is dynamically captured by the model during the inhibitor pretreatment and the inhibitor concentration required to cause a complete enzyme degradation is very low. The activity is completely recovered ~4–5 days after last ticlopidine dose. (c) The S‐ketamine plasma concentrations (blue) after oral dosing (25 mg, t.i.d.) after ticlopidine pre‐dosing (250 mg b.i.d. for 6 days). Ticlopidine plasma concentrations are shown in yellow. High exposure of S‐ketamine is noticeable immediately following the ticlopidine predosing, which drops slowly after ticlopidine has been washed out and intrinsic hepatic clearance recovers to the baseline levels. (d) S‐ketamine plasma concentrations (blue) after i.v. dosing (5 mg t.i.d.) after ticlopidine predosing (250 mg b.i.d. for 6 days). The effect of ticlopidine predosing is less pronounced on the i.v. S‐ketamine administration. This can be attributed to the lack of first‐pass metabolism in this route of administration. However, an accumulation of S‐ketamine can be clearly seen, which wears off as ticlopidine is washed out.
