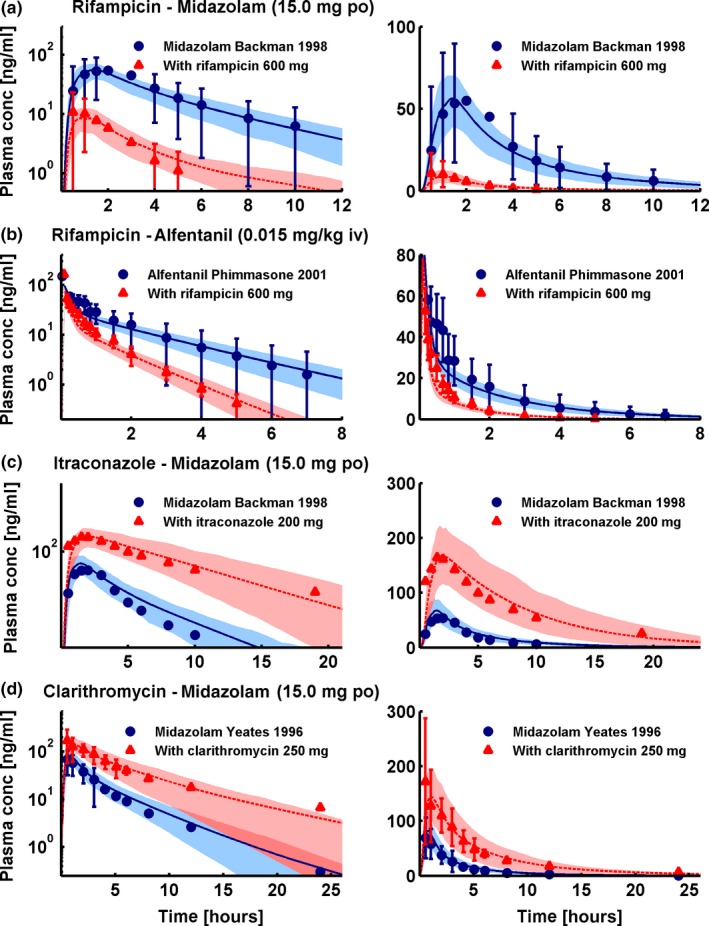
Figure 2.

Cytochrome P450 3A4 drug‐drug interactions (DDIs). Selection of one study each of the rifampicin‐midazolam (a), rifampicin‐alfentanil (b), itraconazole‐midazolam (c), and clarithromycin‐midazolam (d) DDIs, presented in semilogarithmic (left panel) and linear plots (right panel). Shown are population predictions compared to observed victim drug concentration‐time profiles before and during perpetrator administration. Observed data are shown as blue dots (control) or red triangles (DDI) ± SD. Population simulation arithmetic means are shown as solid blue lines (control) or dashed red lines (DDI); the shaded areas illustrate the respective 68% population prediction intervals. Details on dosing regimens, study populations, predicted and observed DDI area under the plasma concentration‐time curve ratios and DDI peak plasma concentration ratios are summarized in Table 1.
