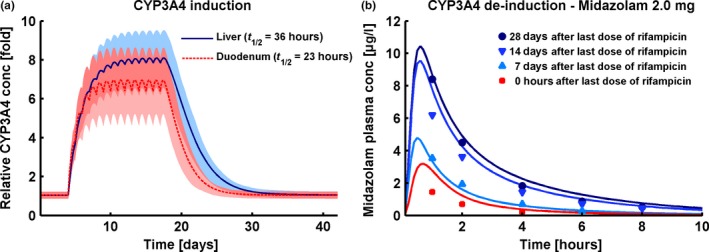
Figure 4.

Cytochrome P450 (CYP)3A4 induction and de‐induction. (a) Fold change of predicted CYP3A4 concentrations in liver (solid blue line) and duodenum (dashed red line) before, during, and after a 600 mg q.d. rifampicin regimen. Shown are population prediction arithmetic means (lines) and 68% population prediction intervals (shaded areas). (b) Population simulation arithmetic means (lines) and observed (squares, triangles, and dots) midazolam plasma concentration‐time profiles during simultaneous administration of midazolam and rifampicin (red line and squares) or administration of midazolam 7 days (light blue line and triangles), 14 days (blue line and triangles) or 28 days (dark blue line and dots) after the last dose of a 600 mg q.d. rifampicin treatment. Observed data are from Reitman et al.12 Predicted and observed DDI area under the plasma concentration‐time curve ratios and DDI peak plasma concentration ratios are given in Table 1.
