Figure 5.

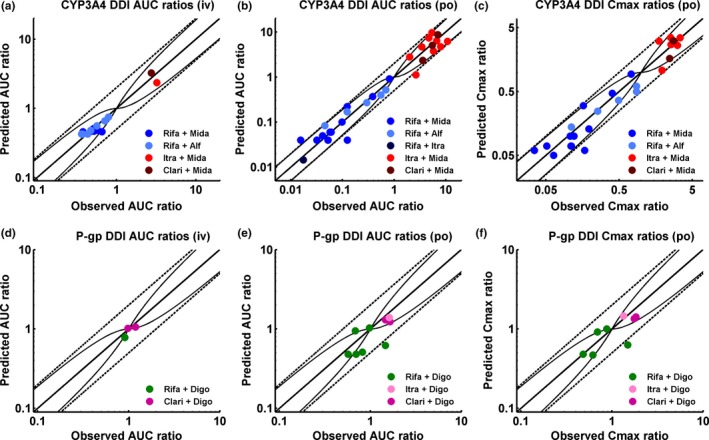
Correlation of predicted to observed DDI area under the plasma concentration‐time curve (AUC) ratios and DDI peak plasma concentration (Cmax) ratios. The upper panel illustrates the cytochrome P450 (CYP)3A4 DDI prediction performance, the lower panel illustrates the P‐glycoprotein (P‐gp) DDI prediction performance of the network. (a, d) DDI AUC ratios of intravenously administered victim drugs, (b, e) DDI AUC ratios of orally administered victim drugs, and (c, f) DDI Cmax ratios of orally administered victim drugs. The line of identity and the prediction acceptance limits proposed by Guest et al.23 are shown as solid lines. The 0.5‐fold to 2.0‐fold acceptance limits are shown as dashed lines. Induction of elimination pathways by rifampicin results in DDI ratios <1, inhibition of elimination pathways by itraconazole or clarithromycin results in DDI ratios >1. Study references and values of predicted and observed DDI AUC ratios and DDI Cmax ratios are listed in Table 1.
