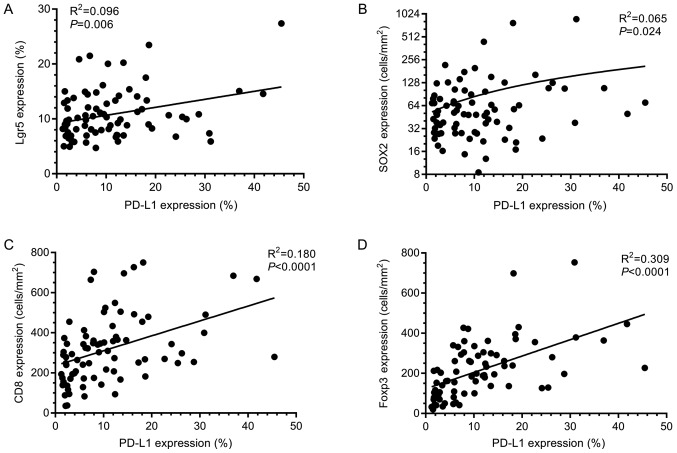
Figure 2.
PD-L1 correlates with immune cell and CSC marker expression. Graphical representation of linear regression results assessing correlations between PD-L1 and (A) Lgr5, (B) SOX2, (C) CD8 and (D) Foxp3 expression. Significant correlations were found between PD-L1 expression and all other markers assessed in this study. Lgr5, Leucine-rich repeat-containing G-protein coupled receptor 5; SOX2, sex determining region Y-box 2; CD8, Cluster of differentiation 8; Foxp3, Forkhead box P3; PD-L1, Programmed death-ligand 1.

