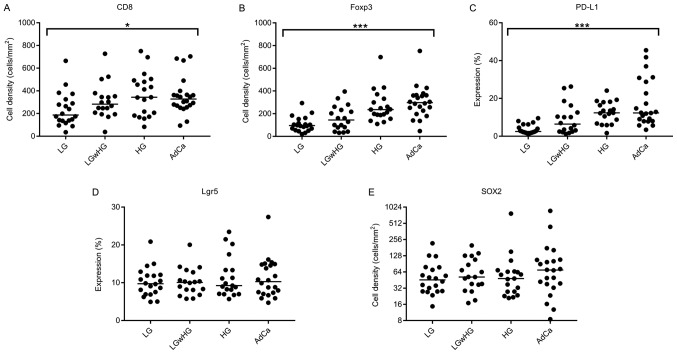
Figure 3.
Expression of each marker with progression of disease. Dots represent individual cases within each group for (A) CD8, (B) Foxp3, (C) PD-L1, (D) Lgr5 and (E) SOX2. Bars represent median values. Immune-related marker expression trends upwards with progression of disease. Although not significant, the median expression of SOX2 in the AdCa groups is considerably higher than that observed in other groups. Expression between groups was compared using the Kruskal-Wallis test. *P<0.05, ***P<0.001. Lgr5, Leucine-rich repeat-containing G-protein coupled receptor 5; SOX2, sex determining region Y-box 2; CD8, Cluster of differentiation 8; Foxp3, Forkhead box P3; PD-L1, Programmed death-ligand 1.

