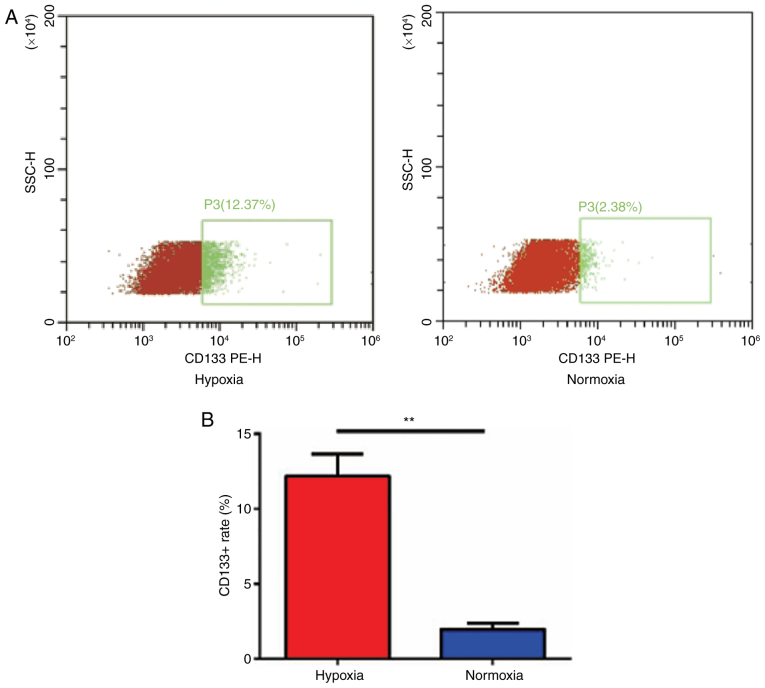
Figure 4.
CD133 expression is increased in U87 cells cultured in a hypoxic environment. (A) Flow cytometry to detect the expression of CD133 of U87 cells under hypoxia and normoxia with the ratio of CD133+ cells shown in the red box. (B) Quantification of the CD133+ fraction of U87 cells. **P<0.01, hypoxic compared with normoxic. CD, cluster of differentiation; +, positive; SSC-H, side scatter height; PE-H, phycoerythrin height.

