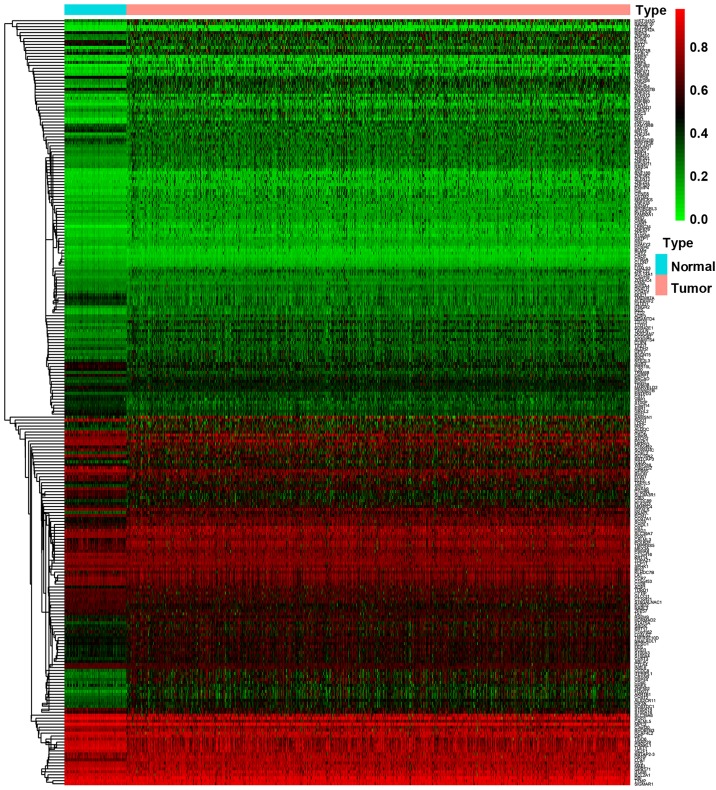
Figure 1.
Thermal map analysis of differentially methylated genes. The pheatmap R package was used for bidirectional hierarchical clustering of differentially methylated genes in breast cancer and adjacent tissues. In the figure, red indicates that the gene is highly methylated in the sample, and green low methylated in the sample.

