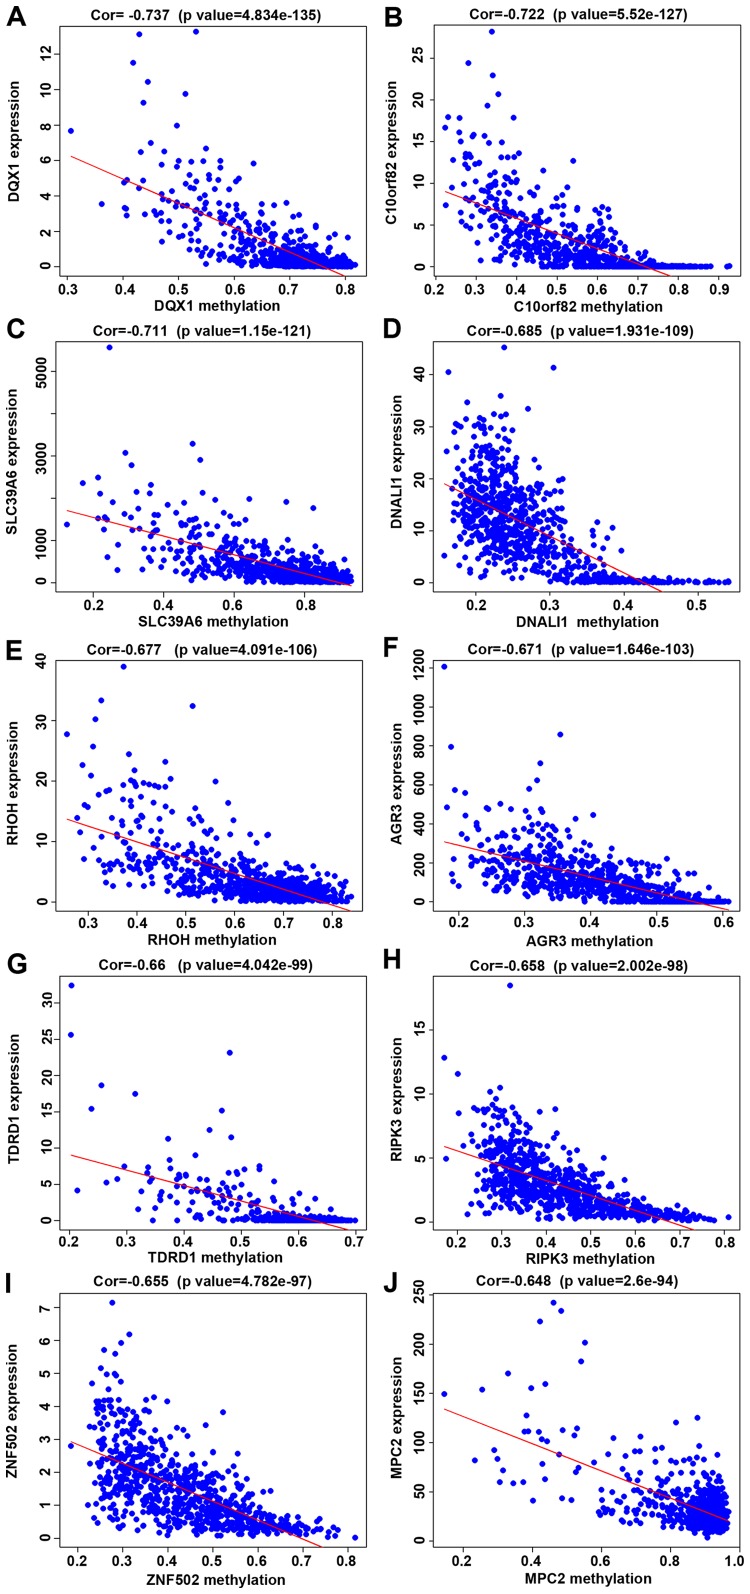
Figure 3.
Correlation between methylation degree of partially differentially methylated genes and gene expression (A-J). Pearson's correlation analysis was used for analysis of the correlation between the methylation degree and gene expression. It can be seen from the figure that the gene methylation degree is negatively correlated with the expression. The abscissa is the beta value of the gene methylation degree, and the ordinate is the expression of the gene. Cor is the correlation coefficient and P-value is the test value of correlation.

