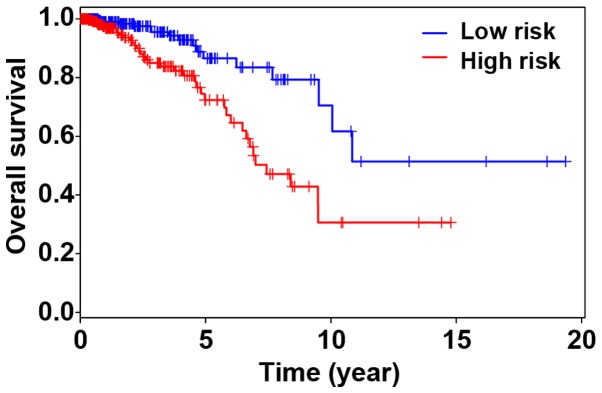
Figure 6.
Survival curve. The patients were divided into high-risk group (>0.936) and low-risk group (<0.936) according to the median value:-0.936 of risk score. The Kaplan-Meier method was used to plot the survival curves of the two groups, and the log-rank method was used to test the difference between them that was significant in the survival rate between the high-risk and low-risk groups (P<0.001).

