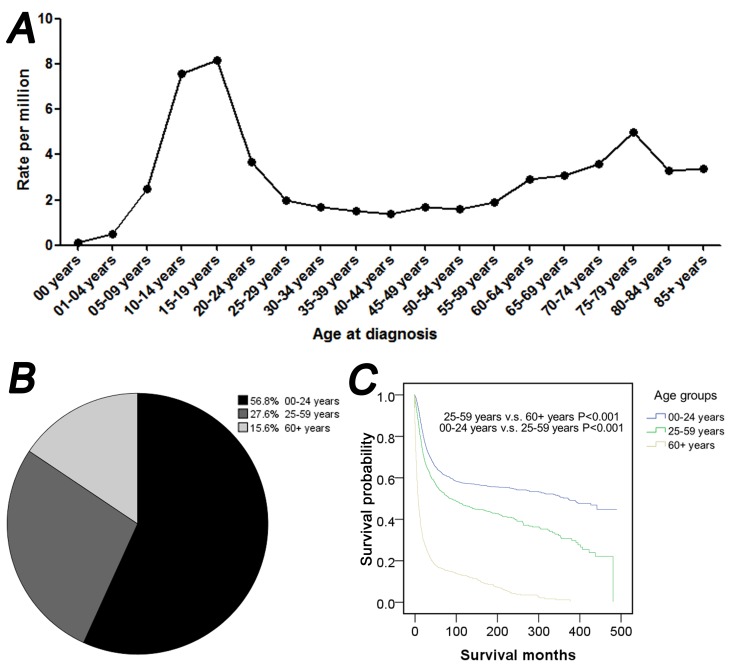
Figure 1.
Osteosarcoma incidence, age distribution and survival, according to the age of diagnosis between 1973 and 2012. (A) Rate of osteosarcoma, according to the age of diagnosis. (B) Pie chart and (C) survival analysis curve of patients with osteosarcoma in the following age groups: 0–24; 25–59 and ≥60 years of age. (C) Survival analysis curve in the following age groups: 0–24; 25–59 and ≥60 years of age.

