
Figure 1.
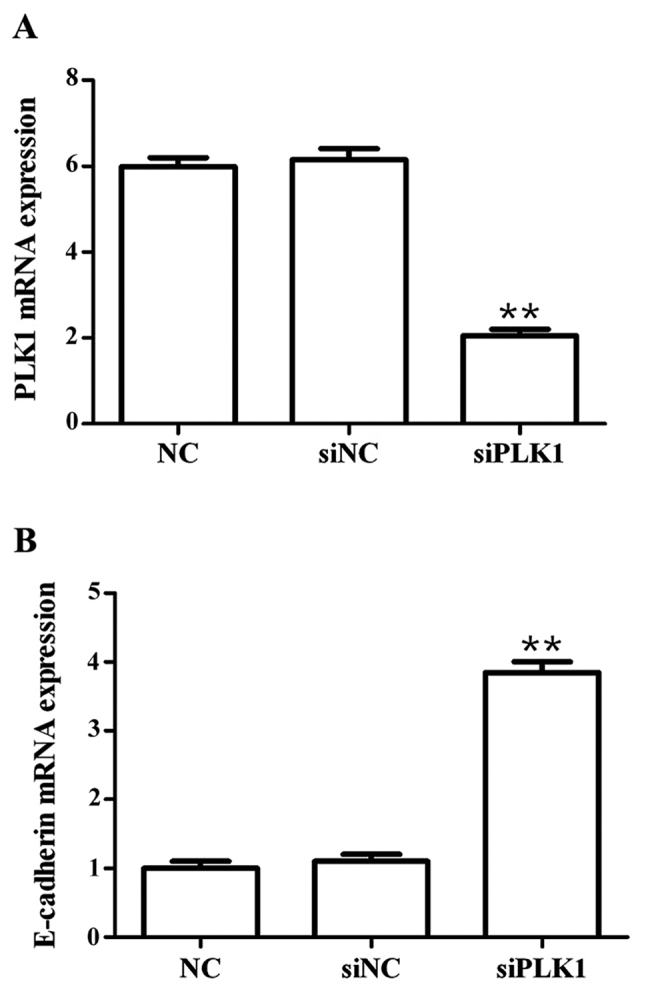
Detection of effects of siPLK1 transfection on mRNA expression of PLK1 and E-cadherin via RT-PCR. (A) PLK1 mRNA expression level. (B) E-cadherin mRNA expression level. Compared with those in blank control group, the PLK1 mRNA expression level is significantly inhibited, but the E-cadherin mRNA expression level is significantly upregulated **p<0.01. PLK1, polo-like kinase.