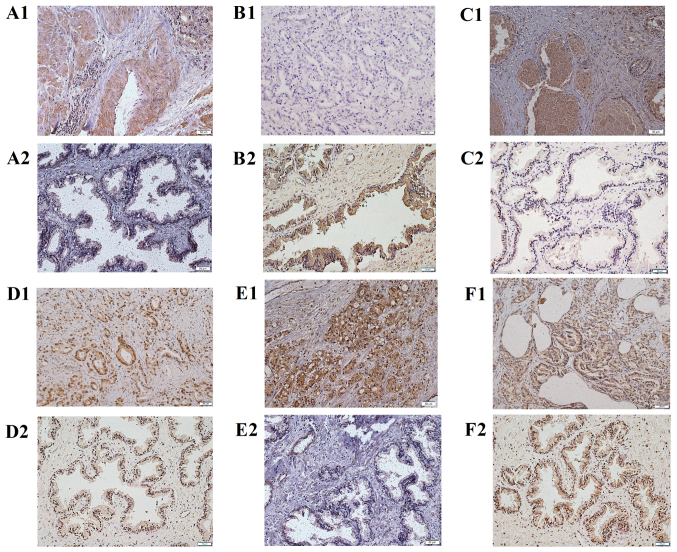
Figure 3.
The expression of DEGs in PCa compared to normal tissues. (A1) RPS21 of PCa; (A2) RPS21 of control; (B1) FOXO1 of PCa; (B2) FOXO1 of control; (C1) BIRC5 of PCa; (C2) BIRC5 of control; (D1) POLR2H of PCa; (D2) POLR2H of control; (E1) RPL22L1 of PCa; (E2) RPL22L1 of control; (F1) NPM1 of PCa; (F2) NPM1 of control. IHC, magnification, ×400. Scale bar, 50 µm. Control: Normal tissues. DEGs, differentially expressed genes; PCa, prostate cancer; IHC, immunohistochemistry; FOXO1, forkhead box O1; BIRC5, baculoviral IAP repeat containing 5; RPS21, ribosomal protein S21; POLR2H, RNA polymerase II subunit H; RPL22L1, ribosomal protein L22 like 1; NPM1, nucleophosmin 1.

