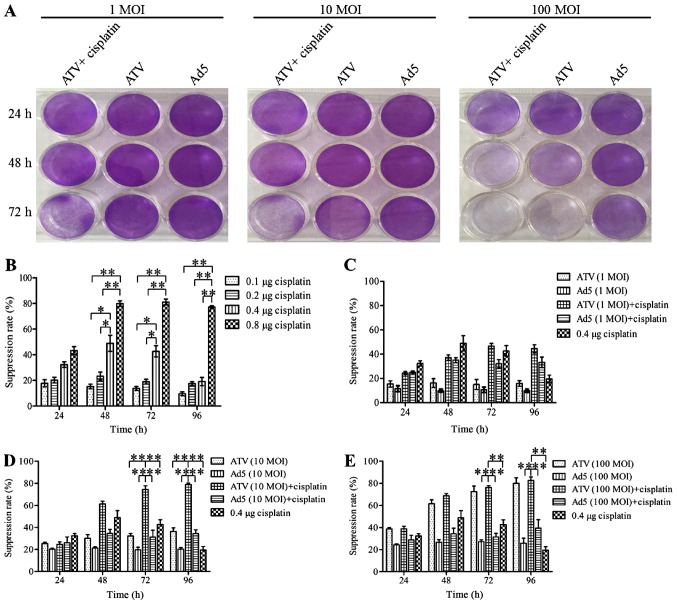
Figure 1.
Plaque formation assay by crystal violet staining and cell proliferation assay by MTS. (A) A549 cells in 12-well plates treated with 1 MOI, 10 MOI, and 100 MOI of ATV and 0.4 µg cisplatin for 24, 48, 72 h and then stained with 0.4% crystal violet after plaque phenotypes formed. (B) The suppression of proliferation of A549 cells treated by 0.1, 0.2, 0.4, or 0.8 µg of cisplatin. (C) The suppression of proliferation of A549 cells infected with 1 MOI ATV or a combination of the 1 MOI ATV and 0.4 µg cisplatin. (D) The suppression of proliferation of A549 cells infected with 10 MOI ATV or a combination of the 10 MOI ATV and 0.4 µg cisplatin. (E) The suppression of proliferation of A549 cells infected with 100 MOI ATV or a combination of the 100 MOI ATV and 0.4 µg cisplatin. All values represent the mean ± SD. **P<0.01 and *P<0.05. MOI, multiplicity of infection; SD, standard deviation; Ad5, human adenovirus serotype 5.

