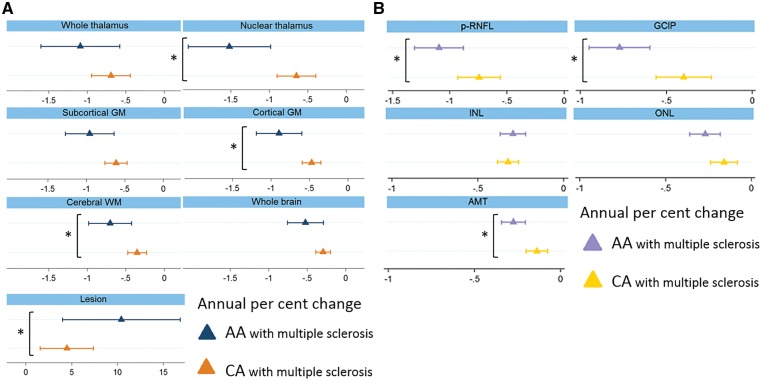
Figure 2.
Rates of brain substructure and whole brain volume changes (A) and retinal layer tissue loss (B) (%/year) in African Americans versus Caucasian Americans with multiple sclerosis. Values displayed in per cent change/year. Triangles represent the coefficient and the bars the confidence intervals. Asterisks indicate significant differences. AA = African American; AMT = average macular thickness; CA = Caucasian American; GM = grey matter; WM = white matter.

