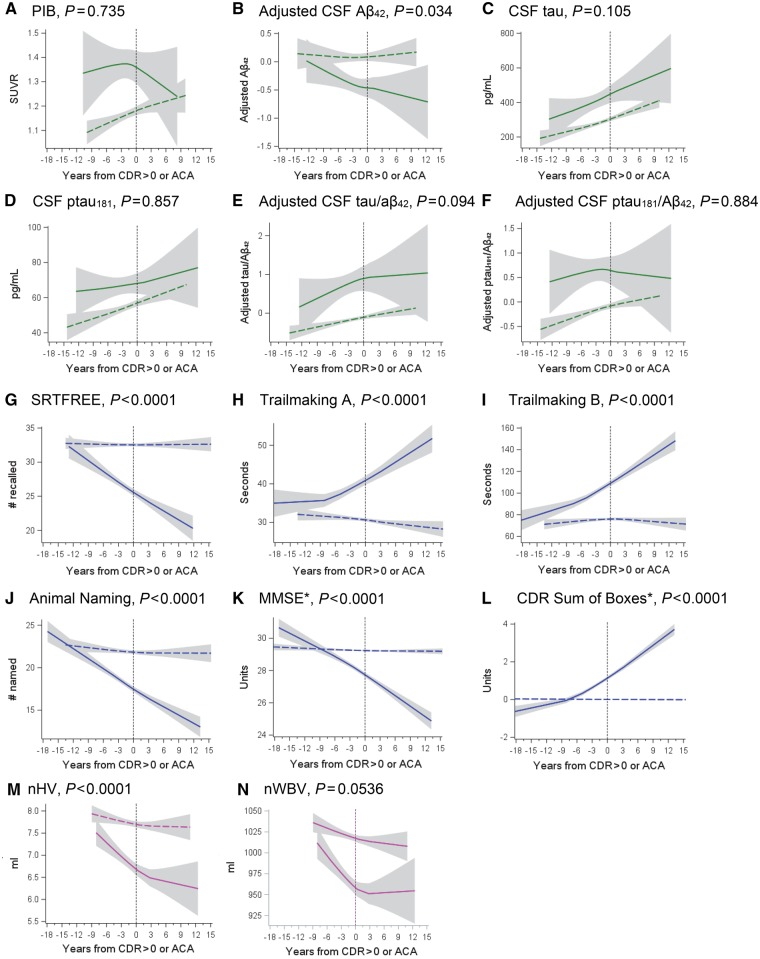
Figure 3.
Biomarker changes for persons who did and did not develop CDR > 0. Comparison of selected biomarker, structural, and clinical changes for persons who did and did not develop CDR > 0. Solid lines represent those who developed dementia and dotted lines indicate persons who remained cognitively normal. P-values indicate whether there was a significant difference in the mean slope of each group. Aβ = amyloid-β; ACA = arbitrary clinical assessment; MMSE = Mini-Mental State Examination; nHV = normalized hippocampal volume; nWBV = normalized whole brain volume. *No persons had MMSE scores >30, nor CDR Sum of Boxes scores < 0. Extension of lines across the x-axis for these measures is an artefact of the curve-fitting process.

