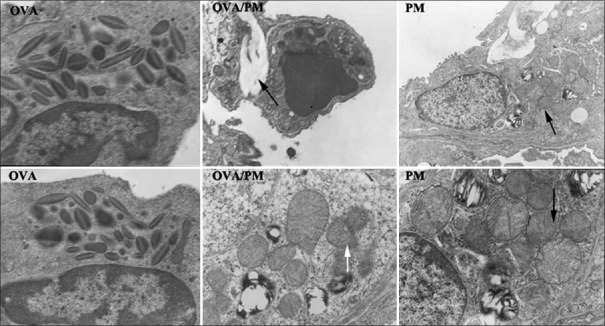
Figure 6.
Comparison of the ultrastructural changes in lung tissues of mice in different groups. The OVA group (both ×15,000) displayed eosinophilic hyperplasia. In the OVA/PM group, black arrow indicates interstitial fibrosis (upper ×8000) and white arrow indicates type II alveolar epithelium with abnormal mitochondria and slight fusion and deterioration of the nuclear membrane and mitochondrial cristae (lower ×5000). In the PM group, black arrows indicate type II alveolar epithelium with abnormal mitochondria and slight fusion and deterioration of the nuclear membrane and mitochondrial cristae (upper ×6000 and lower ×15,000). PM: Particulate matter; OVA: Ovalbumin.

