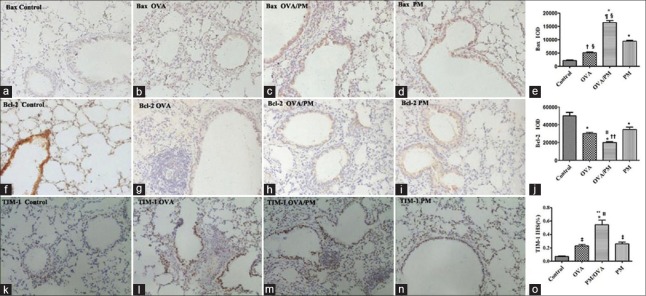
Figure 9.
Effects of PM2.5 on the expression of apoptotic regulatory proteins and TIM-1 in mice in different groups with immunohistochemistry (×200). (a-d) Images of immunohistochemistry of Bax in control, OVA, OVA/PM, and PM groups; (e) IOD of Bax; (f-i) images of immunohistochemistry of Bcl-2 in four groups; (j) IOD of Bcl-2; (k-n) images of immunohistochemistry of TIM-1in four groups; (o) IHS% of TIM-1. Values are mean ± SD. Using one-way ANOVA, followed by LSD multiple range test, comparing with control group, significant difference is indicated by *P < 0.001, †P < 0.01, and ‡P < 0.05. Comparing with PM group, significant difference is indicated by §P < 0.001 and ||P < 0.01. Comparing with OVA group, significant difference is indicated by ¶P < 0.001, **P < 0.01, and ††P < 0.05 (n = 6 per group). IOD: Integral optical density; IHS: Immunohistochemical scores; PM: Particulate matter; OVA: Ovalbumin; SD: Standard deviation; ANOVA: Analysis of variance; LSD: Least significant difference.

