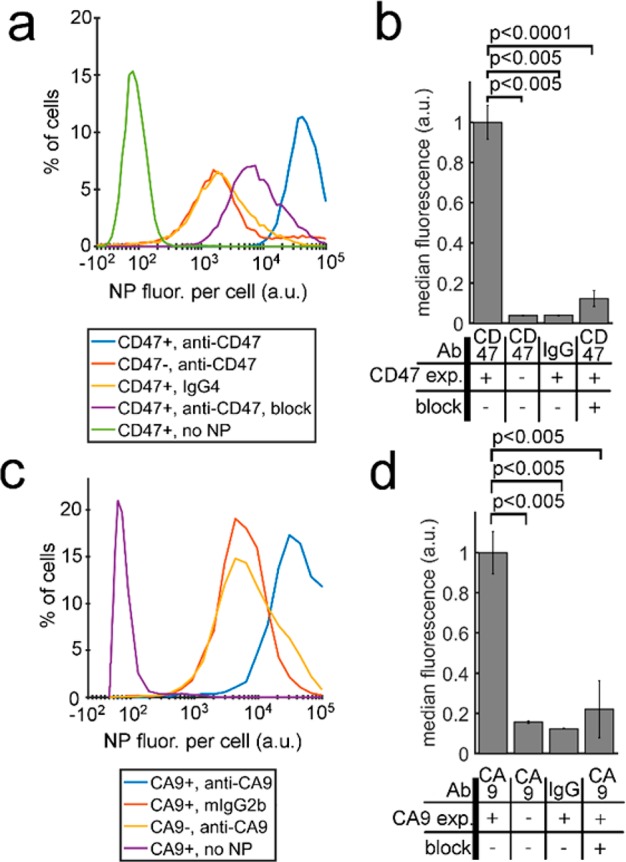
Figure 3.

Validation of active targeting using flow cytometry. (a) Flow cytometry histogram showing binding of CD47-targeted SERS nanoparticles to cells with three negative controls. (b) Experiments from (a) were reported in triplicate and plotted in a bar graph. (c) Flow cytometry histogram showing binding of CA9-targeted SERS nanoparticles to cells with three negative controls. (d) Experiments from (c) were conducted in triplicate and plotted in a bar graph.
