
Figure 6.
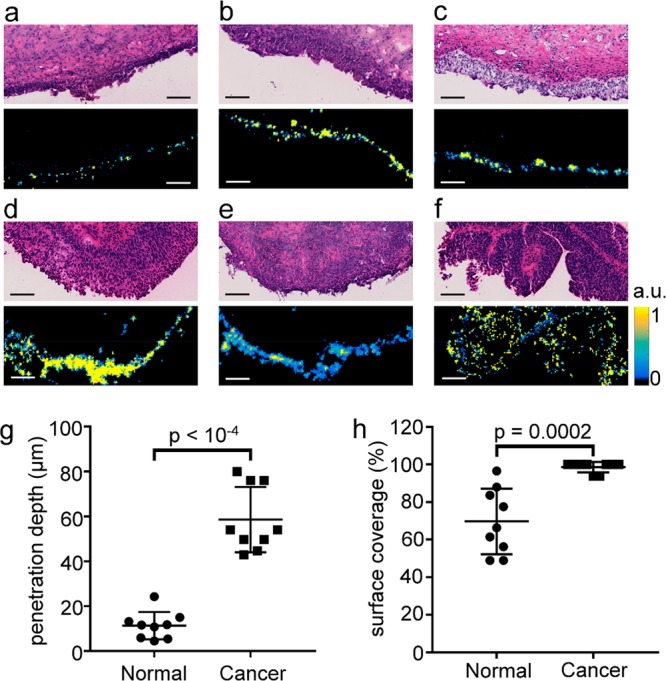
Penetration depth of SERS nanoparticles was 5-fold greater in tumor than normal tissue. (a–c) H&E stains (top) and s421-IgG4 Raman images (bottom) of normal bladder tissue from three separate patients. (d, e) H&E and s421-IgG4 Raman images for a low grade pNx (d), high grade T2 (e), and high grade pTa (f) bladder cancer tissues. All images are on the same scale, and all scale bars are 100 μm. All Raman images are on the same color scale, and the scale bar next to frame (f) applies to all Raman images. (g) Penetration depth in microns for normal and cancer tissue samples. (h) Percent of tissue surface with detectable Raman signal.