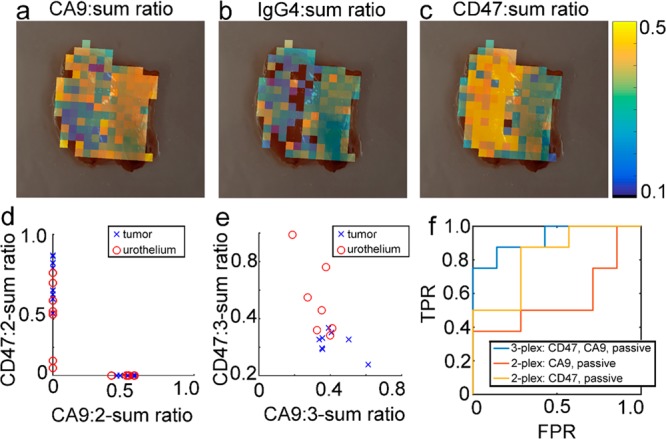
Figure 8.

Approach 3: Classifying bladder tissue with active-to-sum normalized data. (a–c) CA9:sum, IgG4:sum, and CD47:sum overlays for the same tissue samples as in Figure 5a,b. (d) CD47:2-sum and CA9:2-sum ratios for all N = 15 tissue samples scanned on the endoscope. Because the 2-sum ratios only depend on either the s440-CD47 or s420-CA9 signal, the 2-sum ratios do not reflect correlations between s440-CD47 and s420-CA9 binding and thus fall directly on each axis. (e) CD47:3-sum and CA9:3-sum ratios for all N = 15 tissue samples. (f) ROC curves for classification of bladder tissue samples based on 3-plexed and 2-plexed active-to-sum ratios.
