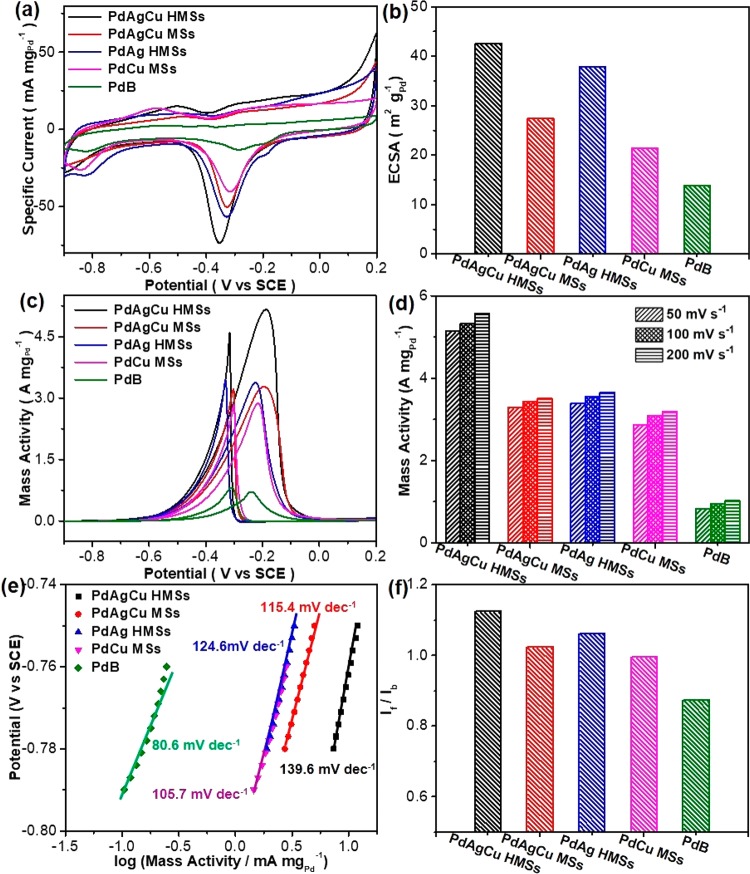
Figure 3.
Electrochemical EOR performances. (a) CV curves and (b) summarized ECSAs of trimetallic PdAgCu HMSs and MSs, bimetallic PdAg HMSs and PdCu MSs and commercial PdB obtained in 1.0 M KOH with a scan rate of 50 mV s–1. (c) CV curves, (d) summarized mass activities, (e) Tafel plots, and (f) If/Ib values of PdAgCu HMSs and MSs, PdAg HMSs, PdCu MSs, and PdB collected in 1.0 M KOH and 1.0 M ethanol with a scan rate of 50 mV s–1.

