Figure 2.
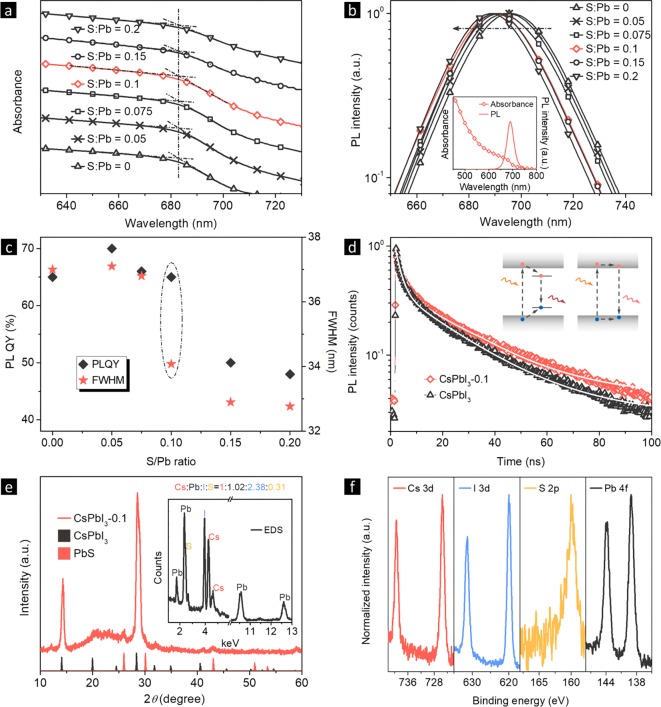
(a) Absorption and (b) PL spectra of CsPbI3 NCs with different S:Pb ratios in toluene. Inset of part b shows the complete absorption and PL spectra of CsPbI3-0.1 NCs. (c) PL QY and fwhm values as functions of S:Pb ratios. (d) TRPL curves of CsPbI3 and CsPbI3-0.1 NCs. (e) XRD pattern of CsPbI3-0.1 NC film on quartz substrate, together with the reference patterns for bulk CsPbI3 (black) and PbS (red). Inset is the EDS spectrum of the CsPbI3-0.1 NCs. (f) XPS spectra of CsPbI3-0.1 NCs.

