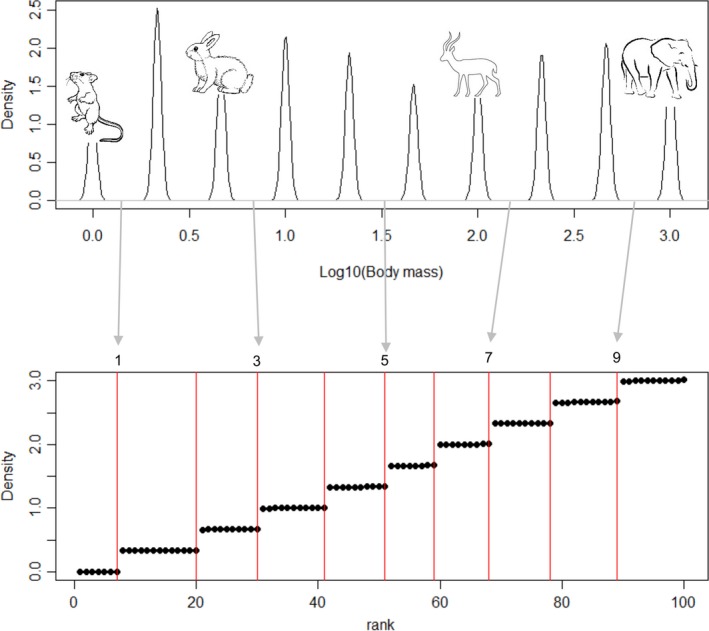
Figure 2.

Hypothetical census of 100 species, sampled from 10 equally weighted normal mixture models and analyzed for discontinuities using the discontinuity detector. Each black dot represents a species, while groups of black dots represent clusters of similarly sized species, and clusters are separated by discontinuities shown with a red line. Inset mammal images illustrate the scaled nature of the body mass distributions being simulated by showing an example of a species that would fall in that hypothetical cluster. Arrows point to the discontinuities in the rank‐ordered census data. The five discontinuities indexed here are presented in the sensitivity analysis
