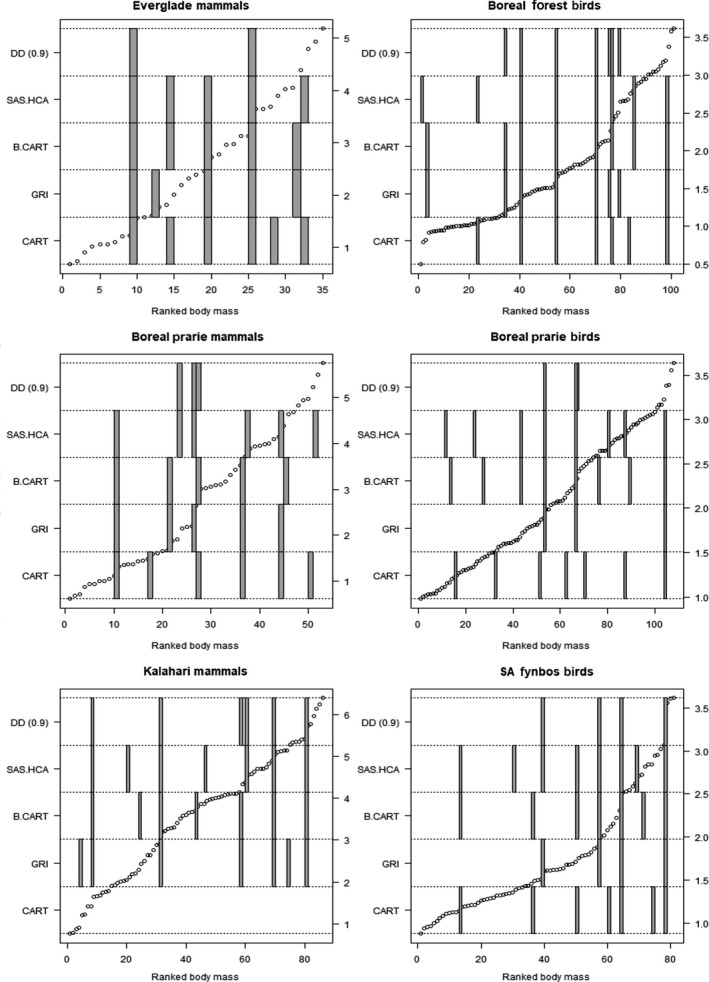
Figure 4.

A comparison of the discontinuity detector versus hierarchical cluster analysis (HCA), Bayesian classification and regression trees (BCART), classification and regression trees (CART), and Gap Rarity Index (GRI). Compared for six datasets from Holling (1992) displayed as a subplot. As shown in Figure 3, within each subplot, the hollow circles represent the raw body mass data (log 10 scale, on right‐hand axis.) against the rank body size (x‐axis). The gray squares represent where a discontinuity has been identified, by each of the different methods. Each method is stacked on top of each other to show which rank the discontinuity has been detected (y‐axis—left‐hand side)
