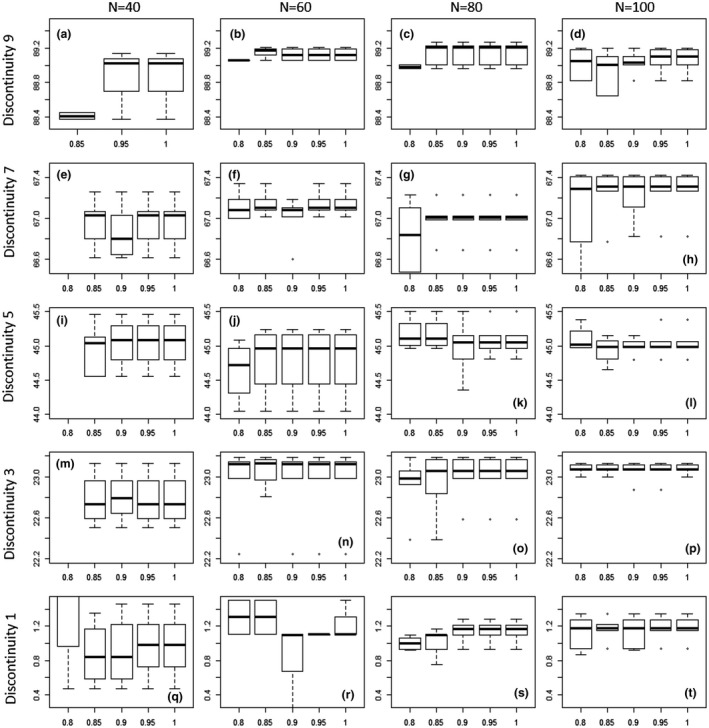
Figure 5.

Sensitivity analysis of the discontinuity detector algorithm under conditions of varying sample size and sampling success. The x‐axis shows the range of sample sizes. Column 1: a, e, i, m, and q = 40 species, column 2: b‐r = 60 species, column 3: c‐s = 80 species, and column 4: d‐t = 100 species. The y‐axis represents five of the discontinuities (number 1, 3, 5, 7, and 9, as generated and shown in Figure 2). Within each subplot, the box and whisker represents the proportional success of the census, so for example, plot Q has 40 species, and shows the consistency of the DD when 80%, 85%, 90%, 95%, and 100% of species are successfully sampled (i.e., how robust is the method to missing species or data in the census)
