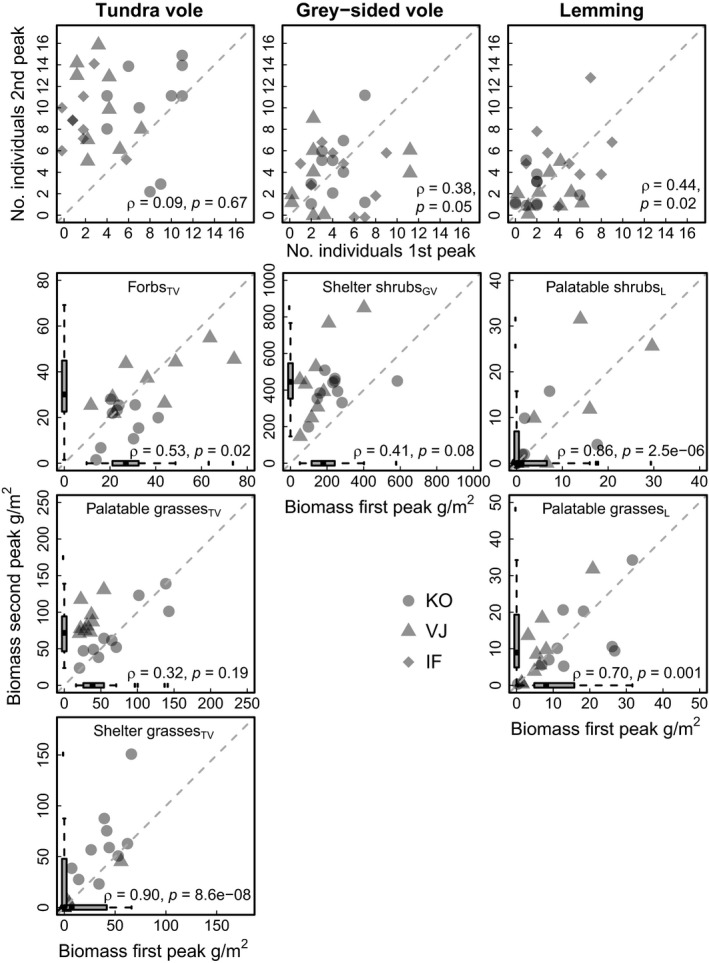
Figure 3.

Temporal consistency of spatial variation within trophic levels. Quadrat‐specific rodent abundance (a) and plant biomass (b) in the first rodent peak (x‐axis) are plotted against the second peak (y‐axis). Statistical assessments of the relative temporal consistency of the spatial variation among quadrats are provided by Spearman rank ρ and associated p‐values. Dashed line shows 1 to 1 line; points above this indicate an increase of from first to second peak, while points below indicate a decrease. Symbols denote data from the different watershed areas, note that data from IF is not included in part B of the plot (as no plant data was collected from IF during the first peak). Box plot bars in the plant plots depict the distribution of the biomass estimates for the two rodent peaks, including also data from the quadrats which were sampled only during one peak. Only plant variables selected to enter the statistical prediction model for each rodent species are included in the plots; similar plots for remaining plant variables are given in Supporting Information Appendix S4
