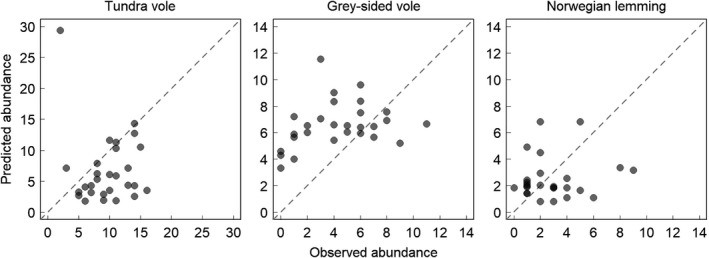
Figure 5.

Observed and predicted abundances of rodents during the second peak (2010–2011). Observed quadrat‐specific rodent abundances during the second small rodent population peak compared with corresponding densities predicted by statistical models built on first peaks data
