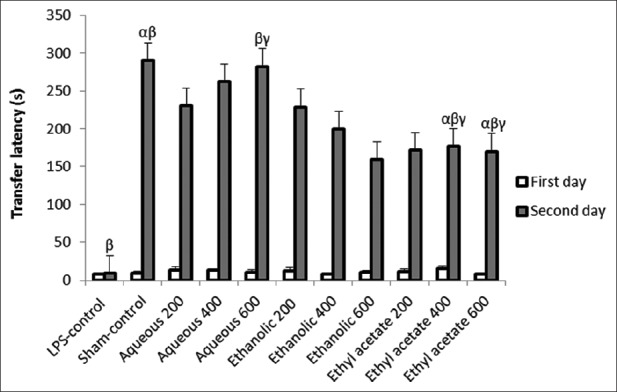
Figure 2.

Effect of total extract, aqueous, and ethyl acetate fractions of A. calamus on transfer latency time. Through Dunnett's test, significant differences were observed among following groups: (1) α indicating the Sham-control group with groups of ethyl acetate at 400 and 600 mg/kg doses. (P < 0.05), (2) β indicating the LPS-control group with Sham-control group, aqueous group at 600 mg/kg dose, and groups of ethyl acetate at 400 and 600 mg/kg doses (P < 0.001), and (3) γ indicating the group of aqueous at dose of 600 mg/kg with groups of ethyl acetate at 400 and 600 mg/kg doses (P < 0.05)
