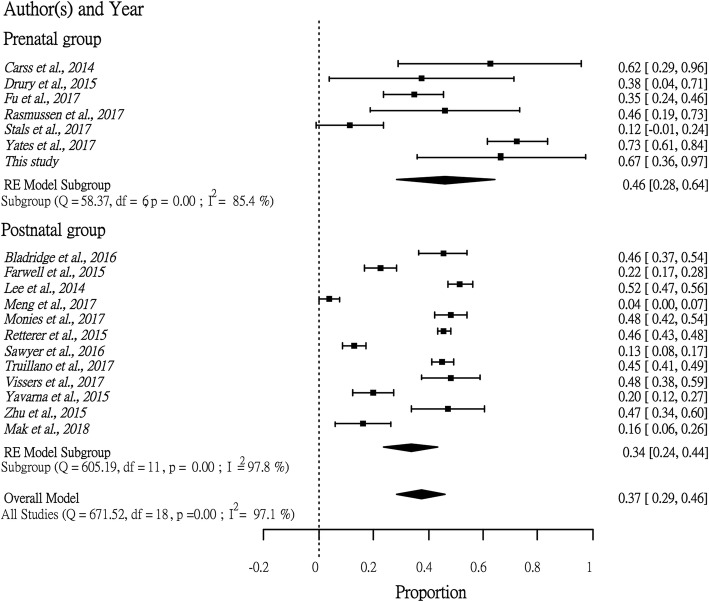
Fig. 3.
Forest plot showing the proportion of VUSs among positive cases between prenatal studies and postnatal studies. The rectangles represent the VUS fraction in each study with 95% confidence interval bounds. The diamond in each group represents the combined proportion of VUSs with all studies included

